15. Polar Coordinates
b. Graphs of Polar Equations
3. Converting to Rectangular
It is sometimes (but rarely) better to convert to rectangular coordinates and then plot the rectangular equation.
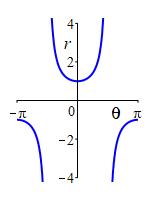
Plot \(r=3\sec\theta\) and identify the shape.
At the right is the rectangular plot of this polar equation. If you attempt to use this to construct the polar plot by looking at values of \(r\) in each quadrant, it is very unlikely that you would obtain a graph that resembles the actually polar plot.
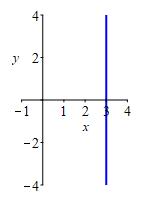
However, since \(\sec\theta=\dfrac{1}{\cos\theta}\), the equation can be rewritten as \(r\cos\theta=3\) or \(x=3\) (since \(x=r\cos\theta\)). We immediately recognize the graph as a vertical line intersecting the horizontal axis at \(3\) as shown.
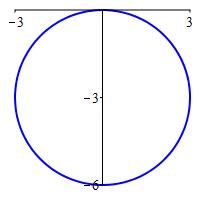
Plot \(r=-6\sin\theta\) and identify the shape.
The polar curve \(r=-6\sin\theta\) is the rectangular curve \(x^2+(y+3)^2=9\) which is a circle centered at \((x,y)=(0,-3)\) with radius \(R=3\).
We substitute \(\sin\theta=\dfrac{y}{r}\), clear the denominator and then substitute \(r^2=x^2+y^2\): \[\begin{aligned} r&=-6\sin\theta \\ r&=-6\dfrac{y}{r} \\ r^2&=-6y \\ x^2+y^2&=-6y \end{aligned}\]
Next we take everything to one side and complete the square: \[\begin{aligned} x^2+y^2+6y&=0 \\ x^2+(y+3)^2&=9 \\ \end{aligned}\] This is a circle centered at \((x,y)=(0,-3)\) with radius \(R=3\).
Heading
Placeholder text: Lorem ipsum Lorem ipsum Lorem ipsum Lorem ipsum Lorem ipsum Lorem ipsum Lorem ipsum Lorem ipsum Lorem ipsum Lorem ipsum Lorem ipsum Lorem ipsum Lorem ipsum Lorem ipsum Lorem ipsum Lorem ipsum Lorem ipsum Lorem ipsum Lorem ipsum Lorem ipsum Lorem ipsum Lorem ipsum Lorem ipsum Lorem ipsum Lorem ipsum